Free Marketing Toolkit Opt-in
(02) 42444411 info@ybrmarketing.com.au
The 2026 Search Shift | From Google SEO to Answer Engine Optimisation (AEO) and IVT Protection

The 2026 Search Shift | From Google SEO to Answer Engine Optimisation (AEO) and IVT Protection

For over two decades, the goal of Australian marketing was simple: rank #1 on Google and get the click. But in 2026, the “click” is becoming an endangered species, and the traffic you do see might not even be human.

Between the rise of Answer Engine Optimization (AEO) and the surge in AI Bot IVT (Invalid Traffic), DIY business owners need a new playbook to ensure their marketing budget actually reaches real people.

In 2026, nearly 40% of Australian searches trigger an AI Overview. When a customer in Perth searches for “Best accounting software for tradies,” Google Gemini synthesises the answer at the top of the page. The user gets their answer without ever clicking a link. This is the Zero-Click reality. To survive, you must move from SEO (getting clicks) to AEO (getting cited as the authority).

The Invisible Drain: AI Bot IVT

While we want “good” bots (like Google’s crawlers) to read our site, 2026 has seen a massive spike in “bad” AI bots. Invalid Traffic (IVT) now accounts for an estimated 50% of all web traffic. These bots don’t just scrape content; they click ads, fill out fake lead forms, and mess with your conversion data.

For a DIY business owner, this means you might be paying for clicks that have zero chance of ever becoming a customer.


3 Practical Steps to Protect and Pivot in 2026

1. Implement “Answer-First” Content (AEO)

AI models prioritize content that is easy to digest. To get cited by Gemini or ChatGPT, you must move away from “fluff” and adopt an Answer-First structure.

  • The Tactic: Start every blog or service page with a concise, 2-3 sentence summary. Use Schema Markup (technical tags) so AI agents know your price and location without “guessing.”

2. Switch to Server-Side Tracking (IVT Protection)

Traditional “browser pixels” are easily fooled by 2026-era AI bots. To minimize IVT, you need to move your tracking from the user’s browser to your own server.

  • The Tactic: Use Server-Side GTM (Google Tag Manager) or Meta’s Conversions API (CAPI). This acts as a “bouncer” for your data—filtering out known bot signatures before they ever hit your Google Ads or Meta dashboard. This ensures you only pay for real human engagement.

3. Lean Into “Lived Experience” (The Human Edge)

The March 2026 Google update hit mass-produced AI content hard. Google and AI agents now reward E-E-A-T (Experience, Expertise, Authoritativeness, and Trustworthiness).

  • The Tactic: Share specific Australian case studies. AI can’t fake a story about a project in the Sutherland Shire or a successful launch in Adelaide. Authenticity is your best defende against both AI “sameness” and bot-driven data.

The Bottom Line for 2026

Visibility is no longer about how many people see your link—it’s about how many AI agents use your expertise and how many real humans you actually reach. By focusing on AEO and hardening your site against IVT, you ensure your agency or business stays ahead of the machine.

I hopes this serves you 😀
Red 

The Search Shift | From Google SEO to Answer Engine Optimisation (AEO) and IVT Protection,AI Bot IVT 2026,Answer Engine Optimization Australia,how to stop AI bot traffic,Google Ads click fraud 2026,AEO vs SEO strategy,server-side tracking for small business,AI agent search trends,March 2026 Google Core Update,ACCC AI guidelines,bot filtering GA4 2026,reducing marketing waste with AI.

Where to find me: Hit me up at our Website or Social Handles 👇👇

Why Bot Activity is the Silent Killer of Australian Ad Budgets in 2026

Why Bot Activity is the Silent Killer of Australian Ad Budgets in 2026

Imagine you own a boutique coffee roastery in Surry Hills. You’ve just launched a high-end Facebook ad campaign targeting “coffee connoisseurs” across Sydney. By midday, your dashboard is screaming success: 500 clicks! Your cost-per-click is at an all-time low. You’re thrilled—until you realize that despite the “engagement,” not a single bag of beans has been sold. Your shop is empty. The phone isn’t ringing.

In 2026, those 500 clicks weren’t humans looking for a caffeine fix. They were a swarm of “Agentic AI” bots from a data-scraping farm in another hemisphere, mimicking human scrolling patterns just well enough to trigger your tracking pixel and drain your daily budget by lunch.

This isn’t just a “tech glitch.” In the Australian marketing landscape of 2026, bot activity has officially evolved into a Stealth Tax. It is a non-negotiable cost of doing business that most small-to-medium enterprises (SMEs) don’t even know they are paying. While you’re busy trying to out-manoeuvre your local competitors, a silent army of scripts is eating your lunch.

1. The 2026 Landscape | Australia’s $1.26 Billion Leak

While global headlines focus on the $63 billion lost to invalid traffic (IVT) worldwide, the story for Australian businesses is uniquely sharp. According to the Global Invalid Traffic Report 2026, Australia’s digital ad spend has hit roughly $16 billion, but approximately $1.26 billion of that is being incinerated by bots before a human even sees the ad.

Why Australia is a High-Value Target

Fraudsters don’t target low-value markets. Because Australia has some of the highest Average Revenue Per User (ARPU) in the world, our “Cost Per Click” (CPC) is significantly higher than in many other regions.

  • A bot clicking an ad in a low-value market might earn a fraudster $0.05.

  • That same bot clicking a “Commercial Litigation Lawyer Sydney” ad can trigger a $80.00 payout.

The SME “30% Rule”

While the national average IVT rate sits around 7.87%, local Australian SMEs are often hit much harder. Large corporations like Telstra or Woolworths have dedicated “Ad Ops” teams and enterprise-level bot-blockers. The average local plumber, real estate agent, or e-commerce startup does not. Consequently, we are seeing local businesses lose as much as 30% of their actual ad budget to fake interactions.

2. Google vs. Meta | Mapping the Danger Zones

In 2026, the risk isn’t equal across platforms. The “Big Two” have different architectures, and the bots know exactly where the cracks are.

Meta Ads: The “Audience Network” Trap

Meta (Facebook and Instagram) remains a powerhouse for Australian discovery, but it carries a “hidden” toggle that is the primary source of waste: the Meta Audience Network.

  • Core Feed (Safe-ish): Clicks within the actual Facebook and Instagram feeds have an IVT rate of roughly 8.20%.

  • The Audience Network (Danger): This is where Meta places your ads on third-party mobile apps and websites. In 2026, fraud rates here have been recorded as high as 67%.

The Rise of “Made-for-Advertising” (MFA) Apps

A common tactic in 2026 involves “junk apps“—think of a low-quality flashlight app or a basic calculator. These apps are designed solely to host ads. They use “pixel stuffing,” where your ad is served in a 1×1 pixel space that is invisible to the human eye, yet the app’s internal bot “clicks” it, and you get charged for a full-screen interaction.

Google’s Search Network (the ads you see on the results page) is arguably the cleanest environment in digital marketing, with an IVT rate of 5.21%. However, Google’s shift toward Performance Max (PMax) has created a transparency issue.

  • The PMax Risk: Performance Max uses AI to spread your ads across Search, YouTube, Gmail, and the Display Network.

  • The Display Leak: Once your ads leave the high-intent Search page and land on the Display Network (random websites), the IVT rate climbs to over 12%.

Key 2026 Stat: Lead-generation businesses (lawyers, tradies, consultants) experience 32.07% higher IVT rates than e-commerce brands because a “lead form” is easier for a bot to fake than a credit card transaction.

3. The “Non-Technical” Translator | What is IVT Exactly?

If you aren’t a data scientist, “Invalid Traffic” can sound like jargon. Let’s break down the three main culprits stealing your money in 2026.

1. The Saboteur (Competitor Click Fraud)

This is the most “personal” form of fraud. If you are a locksmith in Melbourne and you pay $20 per click, your competitor can simply sit at their desk—or hire a cheap service—to click your ads every morning. By 10:00 AM, your daily budget is gone, and their ad moves into the top spot.

2. The Scrapers (Information Thieves)

In 2026, AI companies are hungry for data. They use “Scrapers” to crawl the web to feed their Large Language Models. These bots don’t care about your product; they just want your content. However, to get to your site, they often click your ads because ads are the first things they see on a search page. You pay for their “research.”

3. The Click Farms (The Professionals)

These are organised operations—often overseas—where rows of smartphones are automated to click, scroll, and even stay on a page for 30 seconds to bypass “basic” bot detection. They make your campaign look like it’s performing brilliantly, leading you to spend even more money on a “winning” ad that is actually a dud.

4. The Hidden Damage | Why “Fake Clicks” Ruin Your Future Sales

Most blogs tell you that bots waste your money. That’s true. But in 2026, the bigger problem is that they poison your data.

Ruining the Algorithm’s “Brain”

Google and Meta’s AI systems are designed to find “more people like the ones who clicked.”

  1. If 100 bots click your ad, the AI thinks: “Ah, these are the perfect customers!”
  2. The algorithm then goes out and looks for more bots to show your ads to.
  3. You enter a “Death Spiral” where your ads are perfectly optimised to reach non-humans.

Distorting Your ROI Calculations

If your data says you have a 10% conversion rate, but 30% of your traffic was fake, your real conversion rate is actually much higher—meaning you might be turning off campaigns that are actually working just because the “averages” look bad.

5. How to Fight Back | Actionable Steps for 2026

You don’t need a PhD in computer science to protect your budget. Here is the 2026 “Clean Traffic” checklist:

  • Turn Off “Search Partners” and “Audience Network”: Unless you are a massive brand looking for “awareness,” these are the primary sources of bot traffic. Stick to the “Core” feeds.

  • Exclude “Junk” Placements: Check your Google Ads “Placement Report” weekly. If you see your ads appearing on “Kids Game Apps” or “Flashlight Pro 2026,” exclude them immediately.

  • Use “Negative” Geographies: Even if you only sell in Sydney, bots often use VPNs. If you see a spike in clicks from a specific suburb or country that makes no sense, block those IP ranges.

  • The 5-Second Test: Look at your Google Analytics. If a specific “Traffic Source” has a 95% Bounce Rate and an Average Session Duration of < 2 seconds, it’s not a human. Stop paying for that source.

I hope this serves ya,

Why Bot Activity is the Silent Killer of Australian Ad Budgets in 2026,Ad fraud Australia 2026,invalid traffic statistics,bot traffic impact,Google Ads vs Meta Ads fraud,Performance Max invalid traffic,digital marketing stealth tax,click farms 2026,Australian SME ad waste. Red 

Need a hand? Drop us a Line 📞 🗝 (02) 42444411

Follow Us on Social ⏬⏬

The 51% Reality: Why Half Your Website Traffic Is Fake

The 51% Reality: Why Half Your Website Traffic Is Fake

The Post-Traffic Playbook | Why Local Marketing Must Pivot to “Verified Humans”

If you stood outside your storefront and watched 100 people walk in, but 51 of them were cardboard cutouts pushed by a machine, you would be worried. You certainly wouldn’t count them as “customers.”

Yet, this is exactly what is happening to your website right now.

According to the 2025 Bad Bot Report and data from major hosting networks, 51% of all internet traffic is now automated. For the first time in history, human beings are the minority on the web.   

This shift represents a crisis for traditional marketing. If half your visitors are bots, then half your analytics are wrong, half your ad budget is at risk, and your “traffic growth” charts are likely lying to you.

This guide outlines exactly what is happening and the “Human-First” strategy we are adopting to protect your business.


Part 1: The “Ireland” Anomaly and the Ghost Visitors

When you see a spike in traffic in your monthly report, it’s comforting to think your brand is growing. But in 2025, that traffic is likely comprised of:

  • The Scrapers (37% of traffic): Malicious bots designed to steal your pricing, copy your content, or hunt for vulnerabilities.   

  • The AI Crawlers: Tools like ChatGPT and Claude need to “read” the internet to learn. They visit your site constantly, consuming resources but never buying anything.   

  • The Fake Shoppers: Bots that load carts to check inventory levels or click ads to drain your budget.   

The “Ireland” Anomaly Have you ever looked at your analytics and seen a surge of visitors from Ireland, Virginia, or Singapore? Unless you are a global exporter, this isn’t a new market opening up. These locations are the primary data center hubs for Amazon, Google, and Microsoft. A bot running on a server in Dublin visits your website, looking like a user. To Google Analytics, it counts as a “visit.” To your bottom line, it counts as zero.   

For years, agencies reported on “Traffic” and “Clicks.” But in an era where half of that traffic is synthetic, these numbers have become vanity metrics. A chart pointing up and to the right doesn’t mean profit anymore—it might just mean you’ve been targeted by a scraper farm.


Part 2: Stop Paying for Ghosts (The Ad Fraud Crisis)

The rise of bots isn’t just a measurement annoyance; it’s a financial hemorrhage. In 2025, global losses from ad fraud are projected to exceed $100 billion. For every $3 spent on digital ads, roughly $1 is stolen by bots.   

You might think, “I’m just a local plumber or cafe; why would international botnets target me?” The answer is that they don’t target you; they target the keywords you bid on.

The Two Main Leaks in Local Budgets

  1. The Location Loophole: By default, advertising platforms target people who are “in, or interested in,” your location. This allows a bot in a data center in Singapore to search for “Plumber in” and click your ad. The bot gets paid for generating the click (if it’s on a fraudulent publisher site), and you pay the bill.
  2. The Audience Network Trap: Platforms often extend your ads to third-party apps and websites (the “Audience Network”). These are historically rife with accidental clicks and bot farms. Studies show that excluding these networks can drop lead volume but drastically increase lead quality.

Our Defence: “Verified Presence”

To protect your budget, we are implementing a “Verified Presence” protocol for all campaigns. We are tightening settings to target only people physically located in your service area and cutting off the low-quality display placements where bots thrive. You might see fewer “clicks” on your next report. This is good. It means we stopped paying for the ghosts.


Part 3: Vanity vs. Sanity (The New Measurement Standard)

In the old world of marketing, we celebrated high Click-Through Rates (CTR) and low Cost-Per-Click (CPC). But if 51% of traffic is automated, a cheap click is often just a cheap bot.   

We are shifting our reporting metrics from Volume to Verification. We are no longer asking “Did they click?” We are asking “Are they human?”

The New Metric: Verified Human Action (VHA)

Bots can click ads. Bots can visit pages. But bots are very bad at:

  1. Talking on the phone for 60 seconds.
  2. Walking into a store.
  3. Buying a physical product.
  4. To track this, we are deploying Advanced Call Tracking. We aren’t just counting calls; we are filtering them. Using tools like Nimbata or specialised forwarding, we can tag a “conversion” only when a call lasts longer than one minute. This filters out spam robocalls and wrong numbers.

We are also moving toward Offline Conversion Tracking (OCT). Instead of stopping our tracking at the “Form Fill,” we will work with you to upload sales data back into the ad platform. We tell Google/Facebook who actually bought. This trains the AI to find more buyers, ignoring the bots that simply clicked.


Part 4: The Digital Bouncer (Reputation Defence)

The rise of automation has also weaponised reputation. In late 2025, we saw a massive spike in Google Business Profile (GBP) suspensions and fake review attacks. Bots are now used to flood local listings with fake 1-star reviews (to hurt competitors) or fake 5-star reviews (to boost spam accounts).

The “Local Moat” Strategy

We are taking a proactive stance to guard your digital storefront:

  1. Review Shielding: We monitor your profile daily. If a fake review appears, we appeal it immediately using Google’s Redressal forms. Speed is critical to preventing account suspension.
  2. Building “Owned” Data: The only traffic we can truly trust is the traffic you own. We are recommending strategies like WiFi Marketing for our retail clients. By offering free WiFi that requires an email login, we build a database of customers who have physically been in your store. This is 100% verified human data that no algorithm can take away.

Verify, Then Trust

The internet is getting noisier. The only way to win is to focus on Humanity. By hardening your security, verifying your leads, and owning your customer data, we ensure your business doesn’t just survive the “Bot Era”—it thrives in it.

I hope this serves ya,

The 51% Reality | Why Half Your Website Traffic Is Fake,bot traffic statistics 2025,identifying bot traffic google analytics,imperva bad bot report,fake website visitors,automated traffic surge,marketing analytics accuracy,generative ai web crawlers,internet traffic trends 2026 Red 

Need a hand? Drop us a Line 📞 🗝 (02) 42444411

Follow Us on Social ⏬⏬

The Business Owner’s Guide to Tracking Marketing ROI (Without the Jargon)

The Business Owner’s Guide to Tracking Marketing ROI (Without the Jargon)

The Data Black Hole | Why Your Aussie Marketing Attribution is Broken (And How to Fix It)

The Tuesday Morning Panic

It’s Tuesday morning in Surry Hills. Sarah, a Marketing Manager for a booming e-commerce brand, sits down with her flat white and opens her analytics dashboard.

On the surface, everything looks… okay. Sales are coming in. But there’s a nagging problem. Her boss just walked in and asked for a breakdown of exactly which campaign drove the $50k spike in revenue last month. Sarah looks at Google Analytics 4 (GA4), and it’s staring back at her with a shrug. The dreaded “Direct” traffic source is claiming credit for 40% of her sales.

She knows that’s a lie. People didn’t just wake up, telepathically divine her brand’s URL, and type it in. They saw a TikTok, or a friend WhatsApped them a link, or they saw a digital billboard on the way to work. But the data says “Direct.”

Sarah is flying blind. And if you’re running a business in Australia right now, chances are, you are too.

Attribution—the science of assigning credit to marketing touchpoints—has gone from being a “fuzzy” science to a fragmented mess. Between the upcoming changes to the Australian Privacy Act, the rise of “Dark Social” (we love our Messenger groups down here), and AI eating up search traffic, the old playbook of “last-click” attribution is officially dead.

In this guide, we’re going to look at the blind spots most blogs won’t tell you about, specifically tailored for the Australian landscape, and give you the practical tools to turn the lights back on.


🧠 The Jargon Buster | A Cheat Sheet for Non-Marketers

Before we dive into the deep end, let’s pause. Marketing loves an acronym, and nothing alienates a business owner faster than a sentence full of three-letter words.

If you’ve ever nodded along in a meeting while secretly Googling terms under the table, this section is for you. Here is a plain-English translation of the concepts we are about to discuss:

1. Attribution

  • The Textbook Definition – The process of identifying a set of user actions across screens and touchpoints that contribute to a desired outcome.

  • The Real Talk – It’s the “Blame Game,” but for good things. When a sale happens, Attribution is simply deciding which ad, email, or post gets the credit for it. If you spend $100 on Facebook and get a sale, attribution is the tool that tells you, “Good job, Facebook did that.”
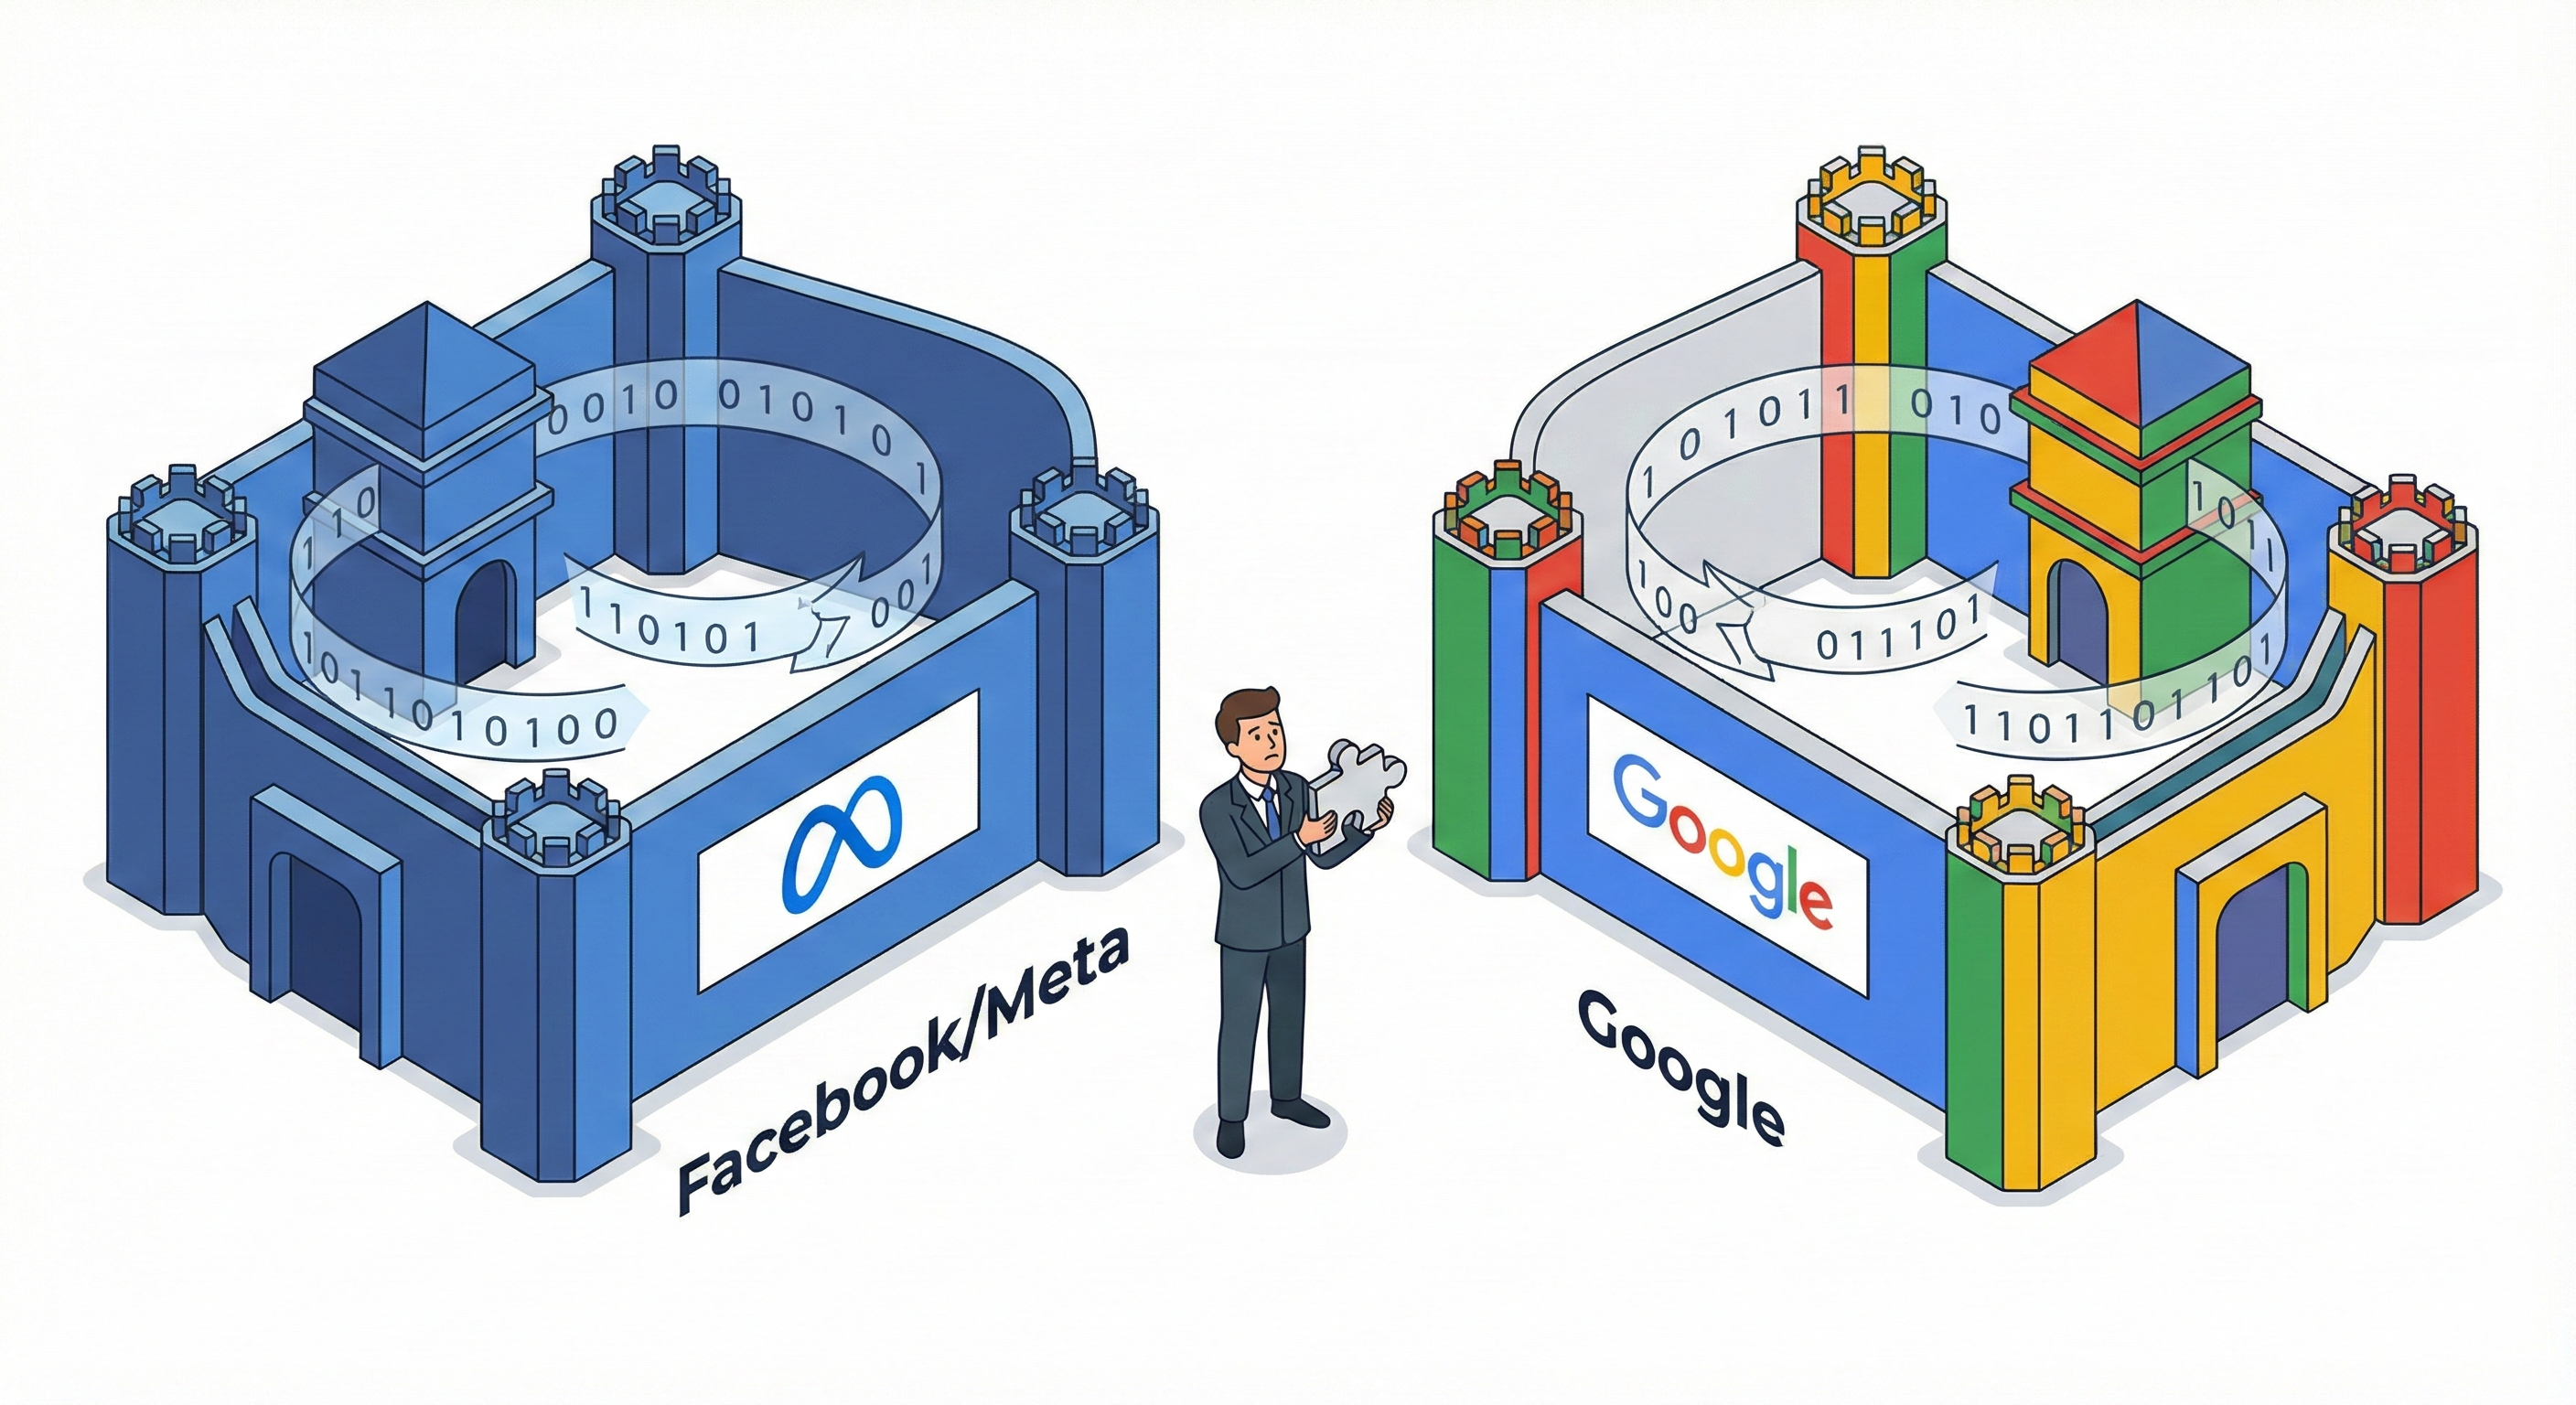
2. Walled Gardens

  • The Real Talk – Think of platforms like Facebook, Google, and Amazon as private clubs. They let you come in and put up posters (ads), but they don’t let you take their guest list (data) home with you. They keep their data behind high walls to force you to keep paying them for access. They don’t share information with each other, which creates gaps in your tracking.
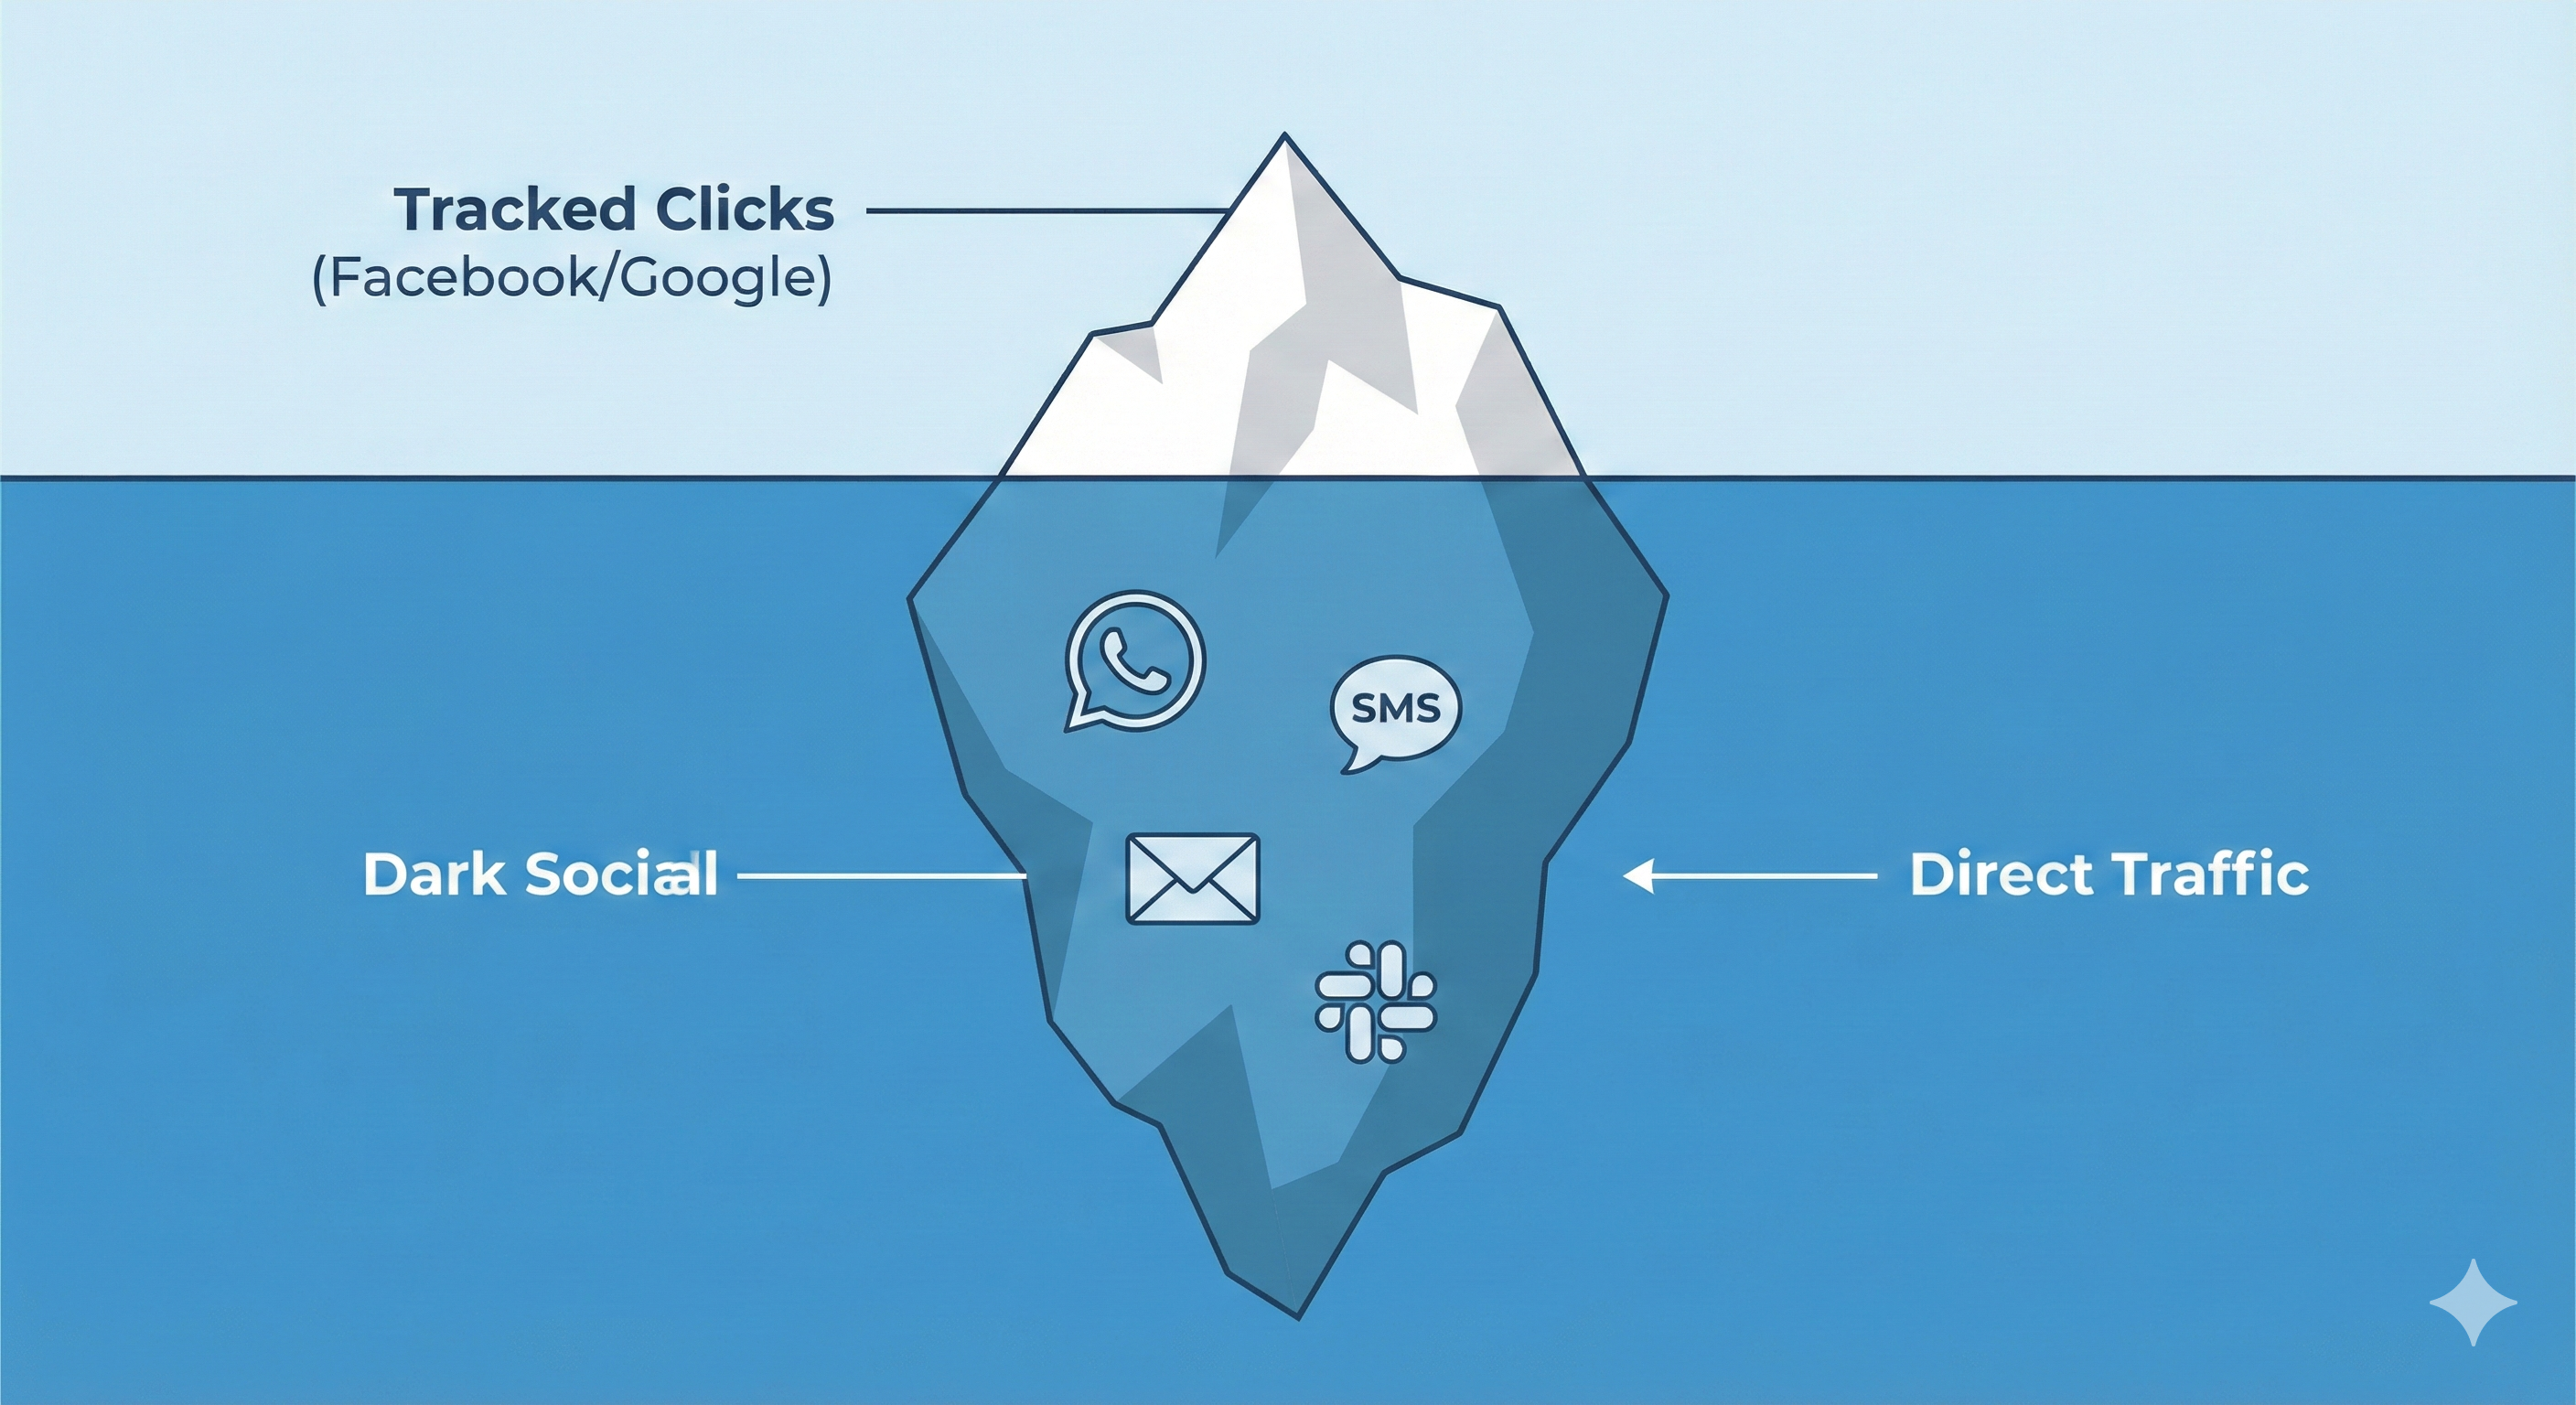
How Google and Meta trap data and don't share it with each other.

3. Dark Social

  • The Real Talk – This sounds ominous, but it just means “invisible sharing.” It’s when someone copies a link and texts it to a friend via WhatsApp, SMS, or email. Tracking tools can’t see inside private messages, so the traffic looks like it came from nowhere (the “dark”).

How most sharing happens privately (WhatsApp) where you can't see it.

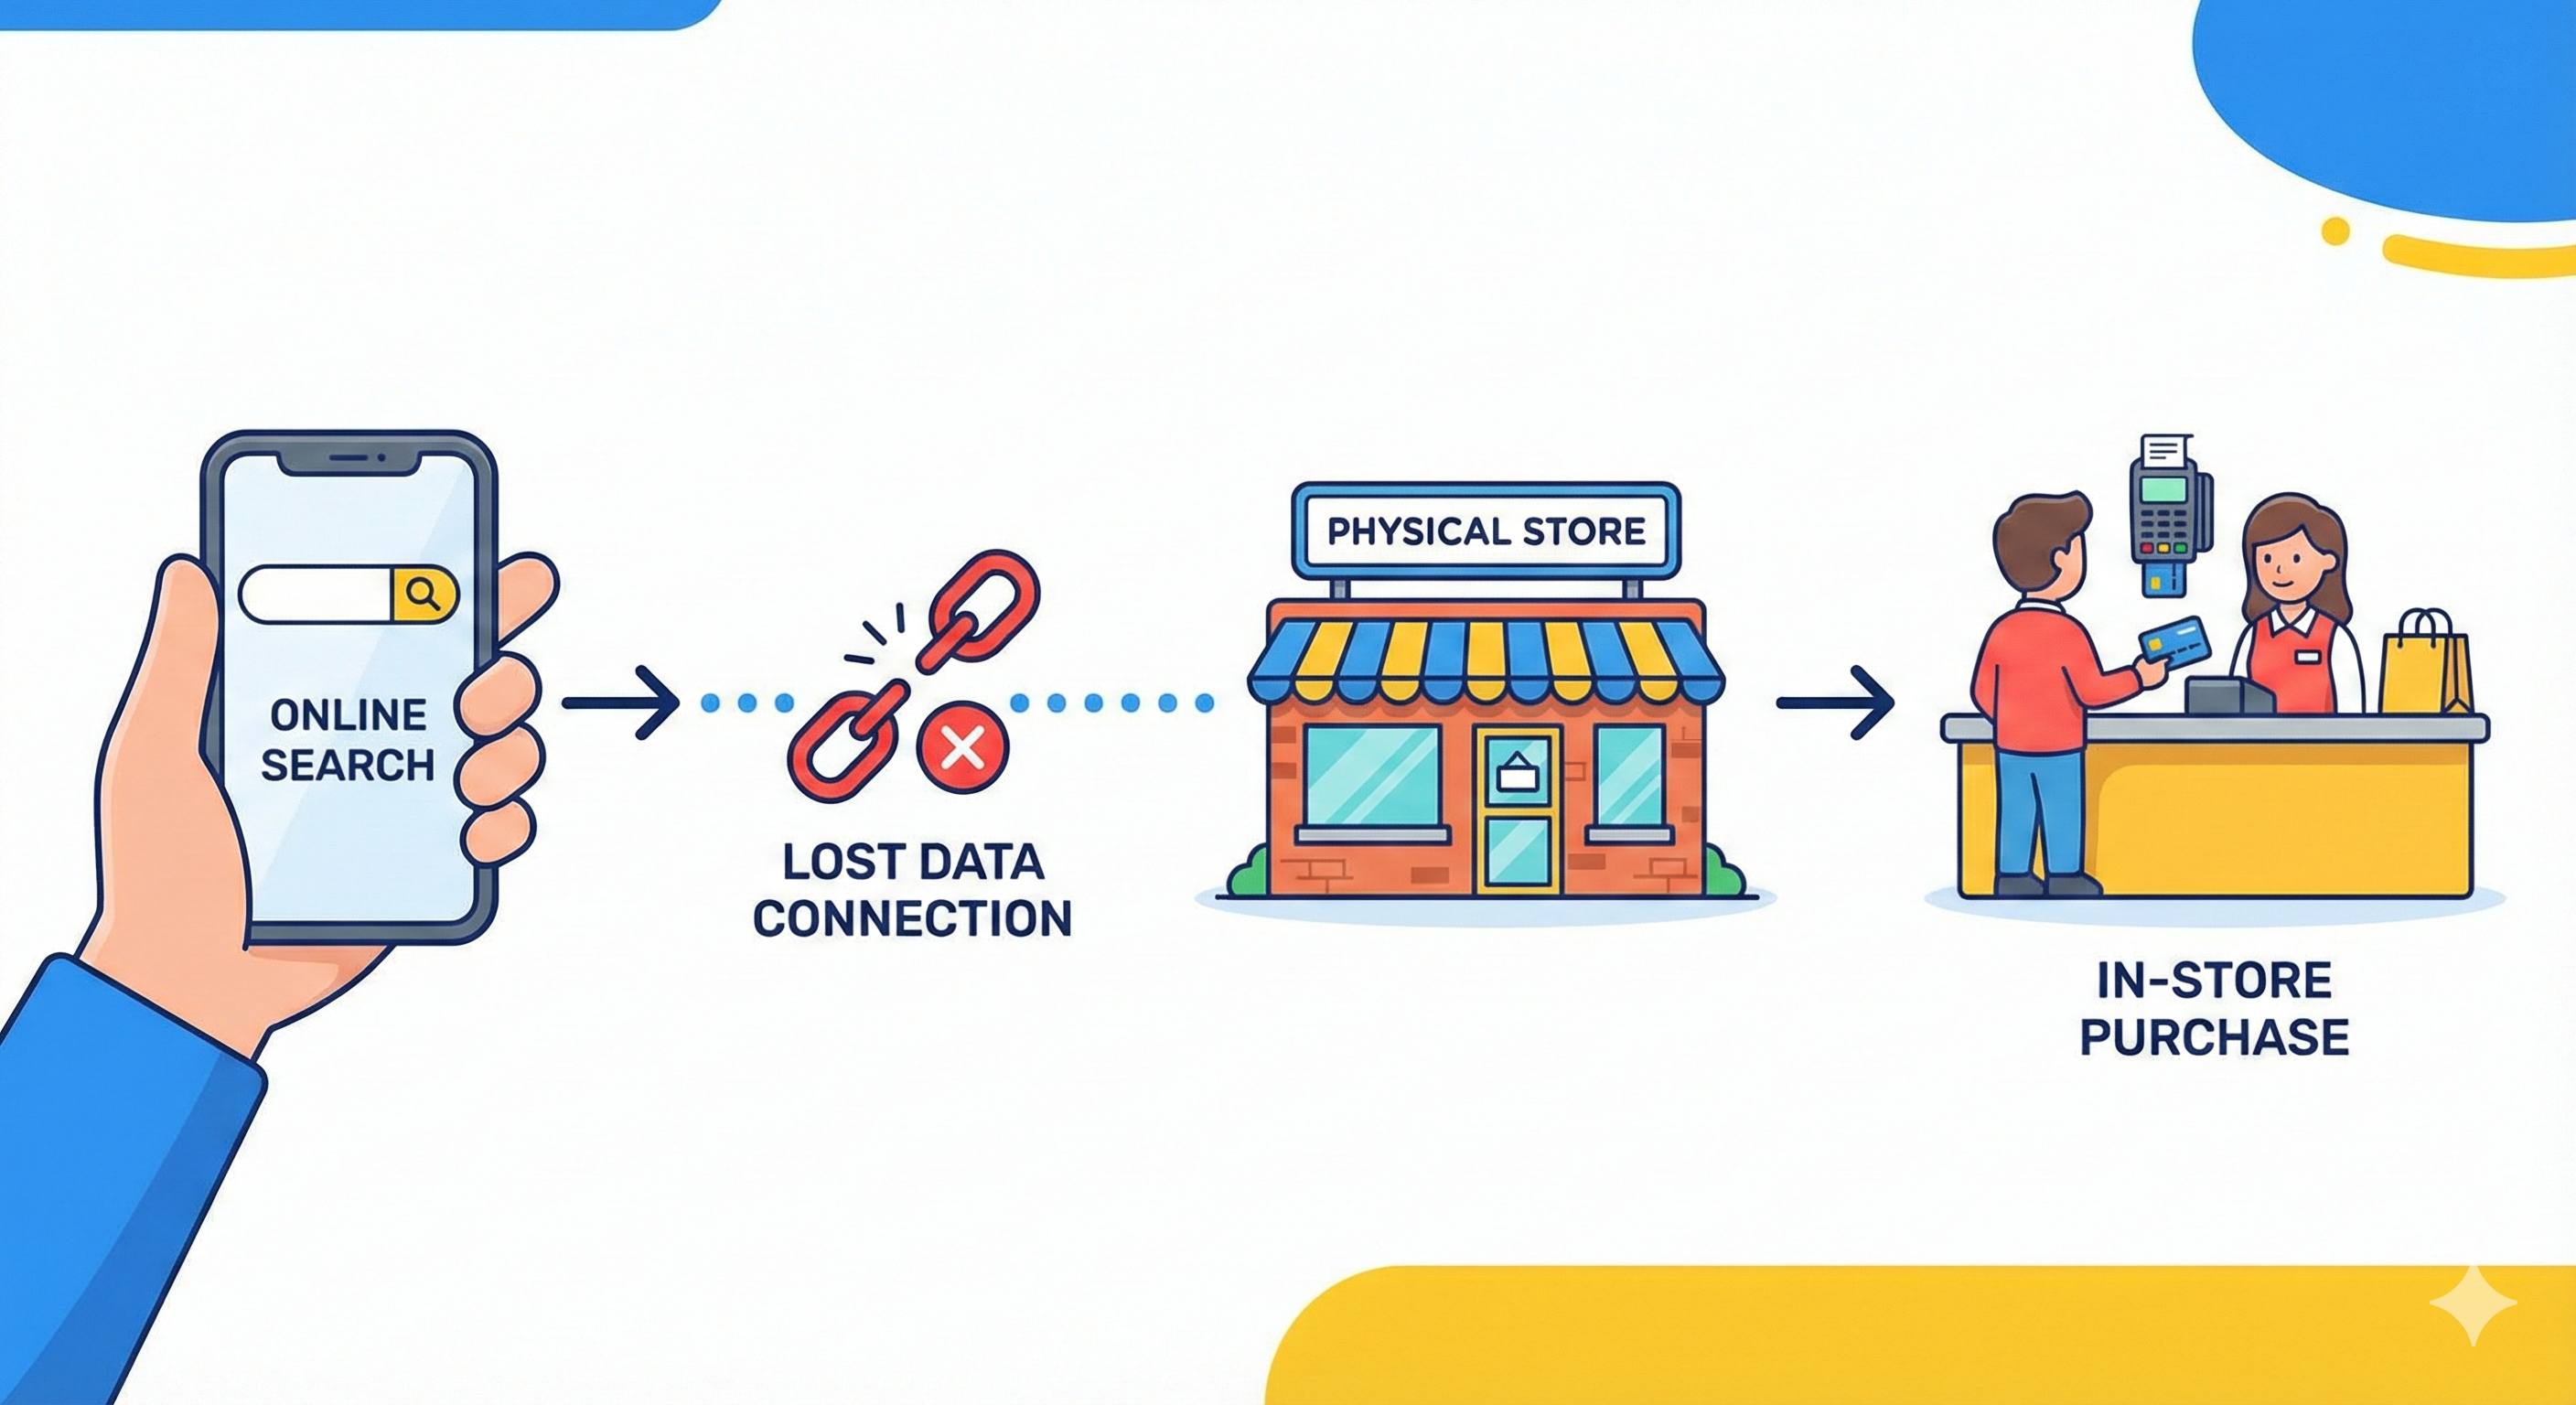
4. ROPO (Research Online, Purchase Offline)

  • The Real Talk – The classic Aussie shopper habit. You look up a new 4WD accessory on your phone while sitting on the couch, but you drive to the store to buy it so you can have it today. The digital ad did the work, but the physical store got the money—and the digital team gets zero credit.

The disconnect between phone searching and store buying.

5. Conversion

  • The Real Talk – The moment the window shopper becomes a buyer. It’s not just a sale; it could be filling out a “Contact Us” form, downloading a brochure, or booking a demo. It is the ultimate goal you want the customer to hit.


The “Flying Blind” Reality | Why It’s Scary

Historically, marketers relied on a simple chain of events: Customer clicks ad > Customer buys product > Ad gets credit.

That world is gone.

In 2024, the Australian internet advertising market grew by 11.1% to reach $16.4 billion. That is a massive amount of money being poured into digital channels. Yet, as spending goes up, visibility is going down. We are dealing with privacy constraints, zero-click searches, and those “walled gardens” we just defined.

If you are still relying on a simple dashboard to tell you where to spend that $16.4 billion, you might be optimising for the wrong things entirely.

The “Black Box” Problem

Platforms like Google and Meta have automated their ad delivery so aggressively that they’ve removed the levers we used to pull. According to recent industry analysis, there are over 90% fewer optimisation permutations in Google and Meta Ads today compared to just two years ago.

You put money in, the algorithm does “something,” and (hopefully) sales come out. But you don’t know why. This is dangerous because when sales stop, you won’t know what broke.


The Major Blind Spots (And Why They Matter in Aus) 

Let’s get specific. You might be staring at your dashboard and missing huge chunks of the customer journey. Here are the biggest culprits that are eating your data.

1. The Walled Gardens (The Giants Don’t Share) 

You rent space on their platforms, but they own the data. If a user sees an ad on Instagram (Meta) but converts later on a desktop search (Google), Meta will claim the credit in their reporting, and Google will claim the credit in theirs.

  • The Result: You might be double-counting conversions. You think your ROI is amazing because both Facebook and Google are taking credit for the same sale. In reality, you’re paying twice to acquire the one customer.

2. The Aussie “Dark Social” Obsession

This is the silent killer of attribution data in Australia. Australians are massive adopters of private messaging, perhaps more so than other markets where public Twitter/X usage is higher.

  • Facebook Messenger: Used by 68.9% of Aussie social media users.

  • WhatsApp: Used by 48.3% and growing fast for business communications.

The Scenario – I see a cool pair of boots on Instagram. I don’t buy them. Instead, I copy the link and paste it into my WhatsApp group chat with my mates, saying, “Thoughts?” My mate clicks the link and buys them. To your analytics software, this looks like “Direct” traffic. There is no “referrer” tag from WhatsApp. The attribution trail is cold. You think my mate is a loyal brand fan who typed in your URL; actually, he’s a cold lead referred by a social ad you paid for.

3. The Offline/Online Disconnect (ROPO)

“Research Online, Purchase Offline” is standard behavior in Australia, especially with our high concentration of physical retail dominance (think Bunnings, JB Hi-Fi, or Mecca).

A customer might click your Google Ad on their mobile while on the bus, browse your catalogue, and then walk into your store in Westfield Bondi Junction to buy it with cash or card.

  • The Blind Spot: Your CRM records a sale. Your Google Ads dashboard records a “wasted” click with no conversion. You might turn off that profitable ad campaign because the data says it’s not working, inadvertently killing your foot traffic.

4. The Looming “Under-16” Data Void

Here is a uniquely Australian curveball: The government has passed legislation to ban social media for children under 16, effective late 2025.

While the primary goal is mental health protection, the marketing implication is a massive, sudden loss of data. If you market to teens (or even products for teens bought by parents), a huge demographic is about to vanish from digital targeting and attribution pools entirely. They will still be consuming media (likely shifting to YouTube, streaming services, or gaming), but the pixel-based tracking you rely on via Instagram or TikTok will evaporate for this cohort.


The Unspoken Truths | What Most Blogs Won’t Tell You

Most articles stop at “cookies are going away.” But the rabbit hole goes deeper.

The “Zero-Click” Phenomenon

Google is trying to answer user queries on the search results page. With AI Overviews (formerly SGE: Search Generative Experience), users can get their answer about your service without ever visiting your website.

  • The Impact: Your “organic traffic” metrics might tank, but your brand awareness could still be high. If you only measure success by “website sessions,” you’ll think your SEO is failing. You need to start measuring Share of Search or brand mentions, not just clicks.

The “Stacking” Effect

The scariest part isn’t one of these blind spots—it’s when they stack.

Imagine a user journey like this:

  1. Sees your ad on a Connected TV (CTV) – Untracked.
  2. Asks ChatGPT about your brand – Untracked (LLM traffic).
  3. Gets a link sent via WhatsApp from a friend – Dark Social (looks like Direct).
  4. Walks into a store to buy – Offline Sale.

In this scenario, your digital marketing team gets literally zero credit for a sale they entirely orchestrated. The business owner sees “marketing spend” with “no return,” while the sales team takes all the glory. This leads to budget cuts that hurt the business.


Strategies to Fix the Mess (The “How-To”) 

Okay, enough doom and gloom. How do we fix it? We need to move from “Deterministic” attribution (exact tracking) to “Probabilistic” attribution (smart modeling).

1. Implement Marketing Mix Modeling (MMM)

Marketing Mix Modeling (baking a cake vs. counting crumbs)

Don’t let the fancy name scare you. MMM is just statistical analysis to estimate the impact of various marketing tactics on sales.

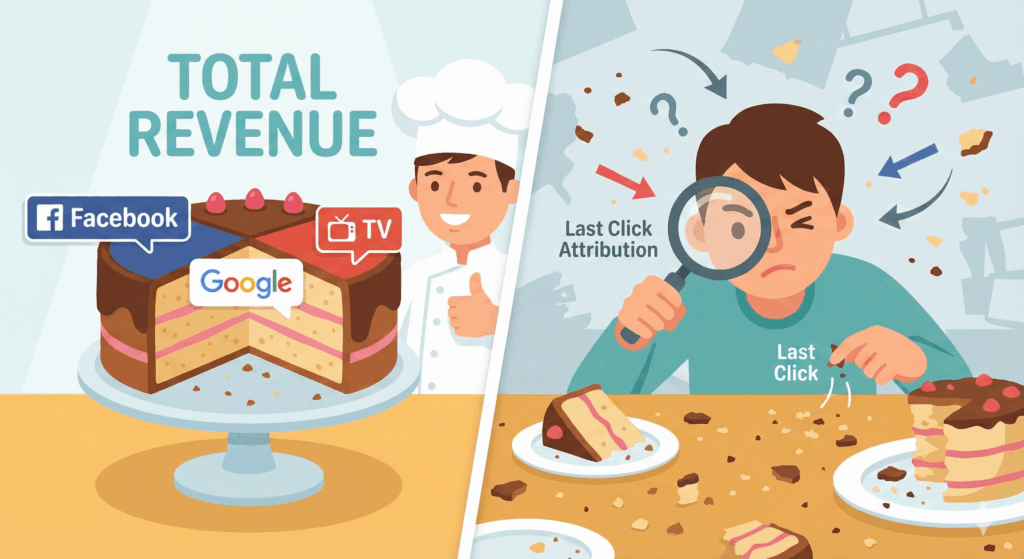
The Cake Analogy: Think of your revenue like baking a cake. You put in flour, eggs, sugar, and chocolate (your marketing channels). The cake tastes great (Sales).

  • Touch-based attribution tries to ask the cake crumb, “Did you come from the egg or the flour?” (Impossible).

  • MMM says, “Last time we doubled the sugar, the cake got sweeter. So sugar drives sweetness.”

You don’t need a math PhD. Tools like Cassandra or even simplified spreadsheets can help you run basic correlation analyses. If you spend more on Facebook in November and sales go up in December (accounting for seasonality), there’s a correlation.

2. First-Party Data is Your Lifeboat

With the Privacy Act reforms looming in 2025, owning your data is non-negotiable. You cannot rely on third-party cookies or Facebook’s audience data.

  • The Fix: Incentivise users to give you their email/phone number early in the process. Use “quizzes,” “exclusive drops,” or “content unlocks” (lead magnets).

  • Clean Your CRM: Ensure your internal data is the source of truth. Feed this “offline conversion” data back into Google and Meta using tools like Google Enhanced Conversions or Meta Conversions API. This helps their algorithms “see” the sales they missed.

3. The “How Did You Hear About Us?” (HDYHAU) Survey

It sounds painfully old school, but it is the #1 killer of Dark Social blind spots.

Add a post-purchase survey on your “Thank You” page. Keep it required, but give open-ended options or a comprehensive list (e.g., “TikTok,” “Friend recommended,” “Podcast”).

  • Why it works: A customer will tell you, “I saw you on TikTok,” even if the tracking pixel said they came from “Google Organic.” Trust the customer; they know their own journey better than a confused robot does.

4. Create “Trap Doors” for Dark Social

If you know people are sharing links in WhatsApp, make those links trackable.

  • Strategy: Don’t just share a generic link. Use unique coupon codes for different channels. If the code “INSTA20” is used, you know it came from Instagram, even if the traffic source says “Direct.”

5. Track “AI Referrers”

People are discovering brands via ChatGPT and Perplexity. By default, this traffic often gets lumped into “Referral” or “Direct.”

  • The Fix: Create custom channel groups in GA4 for “Conversational AI.” Look for referrers like chatgpt.com or bing.com (specifically the chat interface). Segmenting this out will show you if the robots are actually your best salespeople.


Linking Attribution to Business Outcomes | The Metrics That Matter

Finally, stop trying to be perfect. You will never track 100% of the customer journey again. That era is over.

Instead, focus on Directional Accuracy. This simply means you don’t need to know the exact dollar figure every ad produced; you just need to know if the arrow is pointing up or down.

Forget the vanity metrics like “likes” or “impressions.” Here are the three numbers you should actually care about in 2025, explained in plain English.

1. MER (Marketing Efficiency Ratio)

  • What it is: Total Revenue ÷ Total Ad Spend.

  • In English: For every $1 you put into the marketing machine, how many dollars came back out?

  • Why it matters: This is your “North Star” metric because it looks at the whole picture, ignoring whether Facebook or Google claims the credit. If you spend $1,000 across all channels and make $5,000 in total revenue, your MER is 5.0. Simple. It tells you if the business is healthy.

2. CAC (Customer Acquisition Cost)

  • What it is: Total Ad Spend ÷ Number of New Customers.

  • In English: How much cash do you have to hand over to “buy” a new customer?

  • Why it matters: If you sell a coffee subscription for $20, but you spend $100 on ads to get one person to buy it, your CAC is $100 and you’re in trouble. If you spend $100 to get a client worth $5,000, you’re winning. This keeps your profitability in check.

3. Incrementality

  • What it is: The measure of “lift” or true impact.

  • In English: Would this sale have happened anyway?

  • Why it matters: If a customer was already typing your website name into Google, and you showed them an ad, you paid for a customer you already had. Incrementality measures the extra sales that wouldn’t have existed without that specific ad.

  • How to test it: Turn off ads in one state (like Queensland) or other geo-location for two weeks and see if sales drop compared to NSW or other area. That drop is your “incremental” value.


So Finally 

The “blind spots” in marketing aren’t going away; they are becoming part of the landscape. The Australian market, with its specific privacy laws and heavy reliance on social messaging, is a particularly tricky terrain.

But here is the good news; Your competitors are likely ignoring this. They are still staring at GA4, scratching their heads about “Direct” traffic, and turning off high-performing awareness campaigns because the “last click” didn’t show a sale.

By embracing a mix of First-Party Data, MMM, and good old-fashioned Customer Surveys, you can build a system that sees through the fog. You don’t need perfect data to make smart decisions—you just need better data than the other guy.

So, close the spreadsheet, go talk to your customers, and start measuring what actually moves the needle.


References:

  • IAB Australia Internet Advertising Revenue Report (2024)

  • Neil Patel: Marketing Attribution Blind Spots

  • Australian Government: Privacy Act Review Report

  • Genroe: Social Media Statistics for Australia

I hope this serves ya,

marketing attribution Australia,attribution blind spots,dark social meaning,marketing efficiency ratio explained,ROPO Australia,Privacy Act 2025 marketing,digital marketing ROI,GA4 for business owners.,The Business Owner’s Guide to Tracking Marketing ROI (Without the Jargon) Red 

Need a hand? Drop us a Line 📞 🗝 (02) 42444411

Follow Us on Social ⏬⏬

Call Now Button